

Fresh Features-The Option Skew "Shadow"
Analyzing the Volatility Smile in both Strike View & Delta View

Deribit → Options → Historical
We’ve added a cleaner way to analyze current and past behavior of the volatility smiles.
Combine these charts with the “Volatility footprint” (below) for truly wholistic insights.
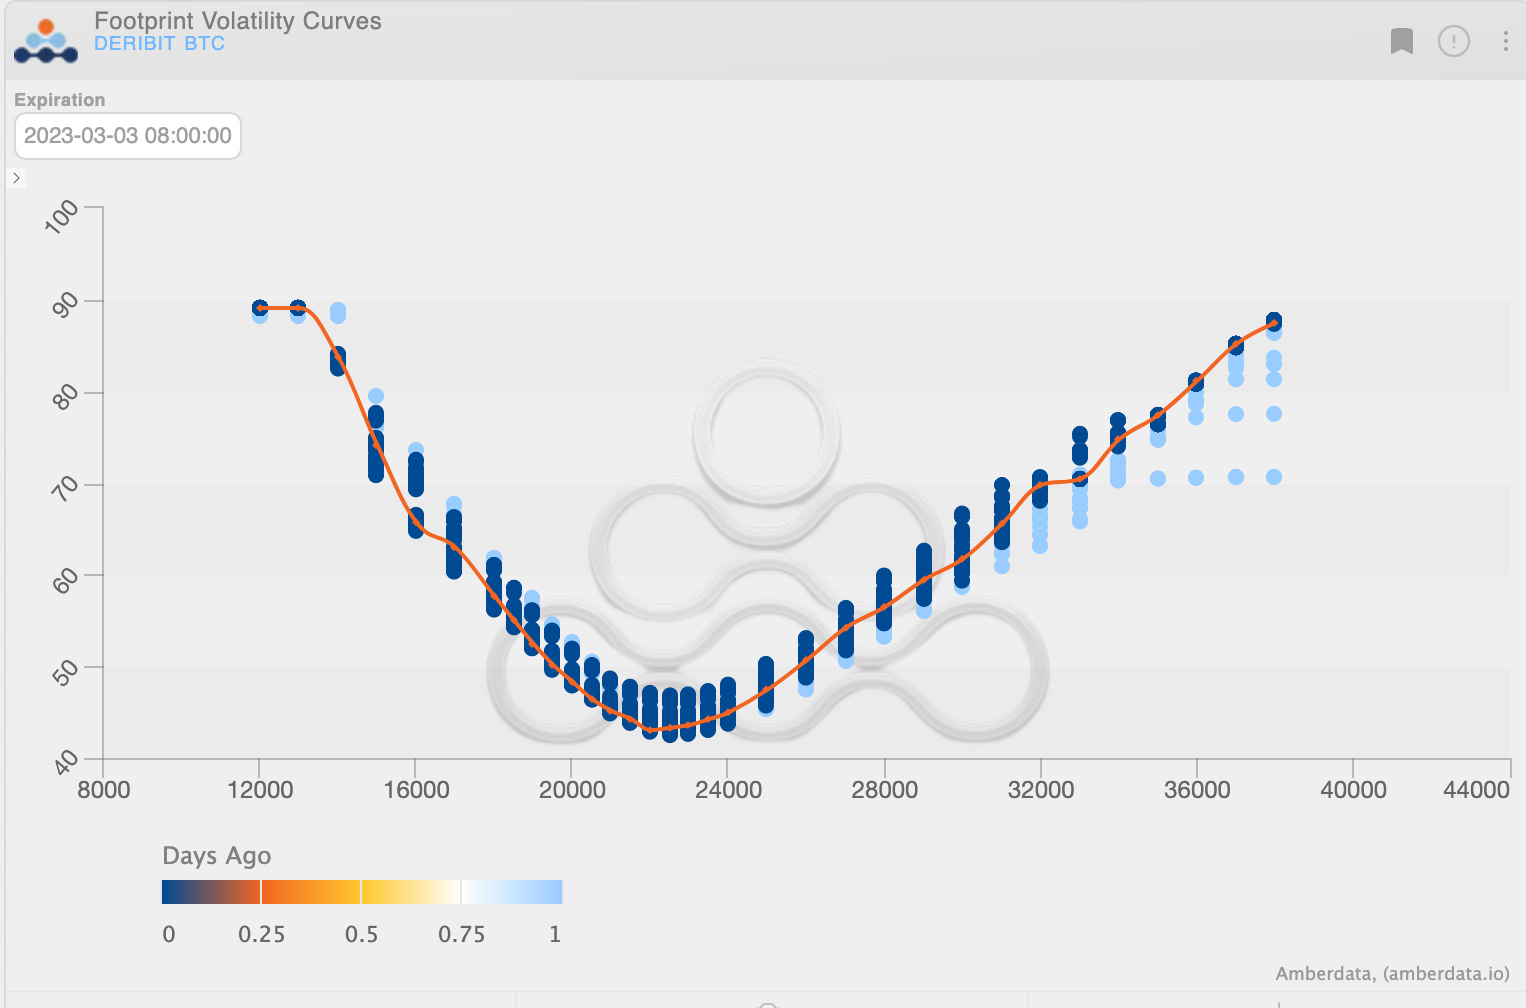
Shadow Skew Strikes
This chart depicts for the selected expiration, the implied volatility curves time, across a strike space

Shadow Skew Delta
This chart depicts for the selected expiration, the implied volatility curves time, across a delta space. Using delta, instead of specific strikes gives the possibility to compare curves in time without any distortion caused by underlying price move.
