Fresh Features: DVol & ∆25 RR-skew

This week we released a new visual. [options → deribit→ DVol]
This chart depicts the relationship between Deribit’s DVOL index and 30-DTE, ∆25 RR-Skew.
The scatter plot reflects the past month of hourly data, enabling users to quickly see the relationship (slope) between 30-DTE ∆25 RR and DVOL.

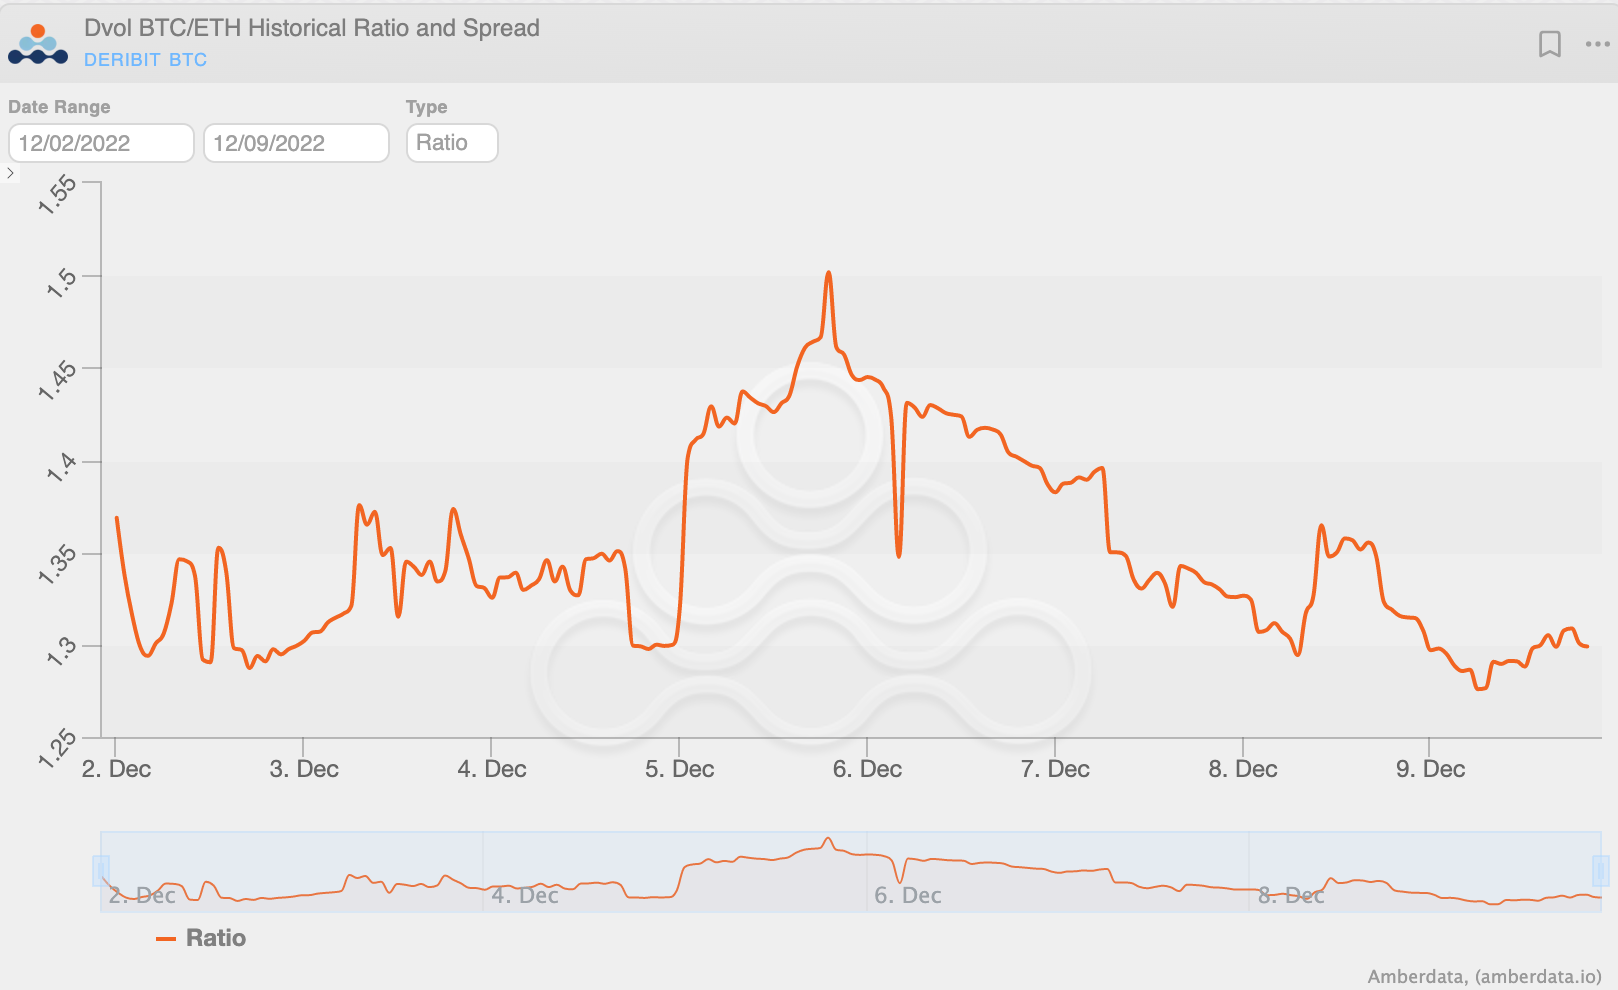
Another new release is the DVol ratio (or spread) between BTC DVol and ETH DVol.
Here we see ETH Dvol (divided by) BTC Dvol, allowing users to quickly see the vol. premium of ETH.